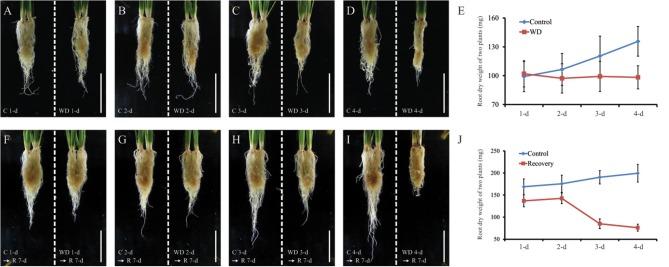
Figure 2.
Physiological responses under drought stress of rice roots grown in soil. The plants grown for 4 weeks was exposed WD for 1, 2, 3, or 4 d and the dry weight was measured in roots (A–E). After 7-d of recovery, dry weight was measured (F–J). C1, C2, C3, and C4, untreated control (roots from well-watered pots) corresponding to plants under 1 d of water deficiency (WD1d), 2 d (WD2d), 3 d (WD3d), and 4 d (WD4d). Scale bar = 5 cm. N = 3 for (A–D, F–I); and n = 200 for (E,J).

