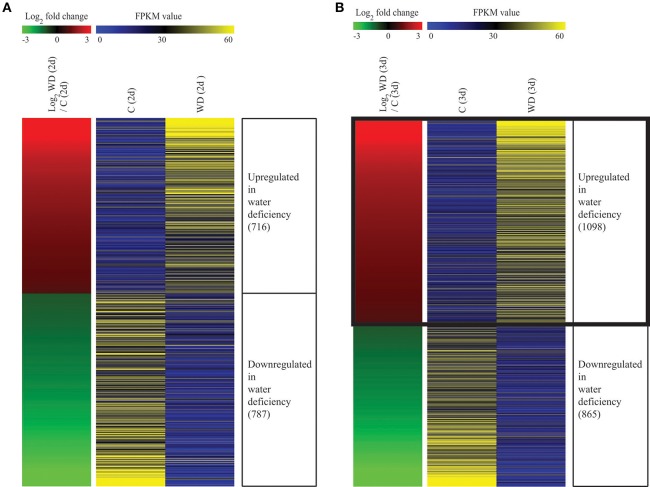
Figure 3.
Heatmap of differentially expressed genes under drought stress. Using RNA-Seq data processing under criteria of FPKM > 4, p < 0.05, and ratio of <–1.0 for 1 <log2 roots exposed to water deficiency (WD) vs. mock-treated rice roots (Control, C), we identified 1,503 differentially expressed genes (DEGs) after 2 d of drought treatment (A) and 1,963 DEGs after 3 d of treatment (B). In left panel, red color indicates upregulation in WD/C comparison; green, downregulation in WD/C comparison. Right panel shows average normalized FPKM values from RNA-Seq experiments; blue indicates lowest expression level and yellow, highest level. Detailed data about RNA-Seq analysis are presented in Tables S3, S4.

