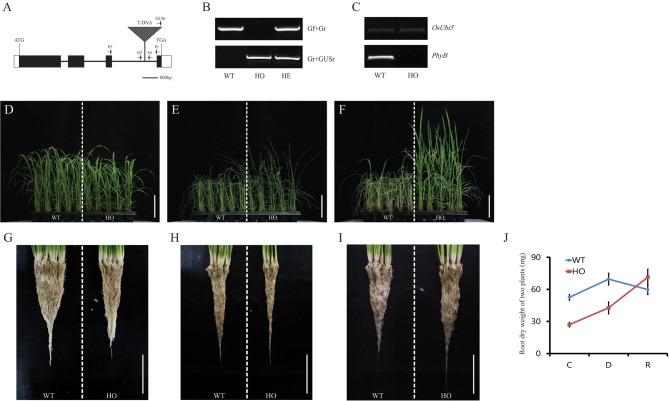
Figure 8.
Drought-stress response mediated by PhyB using T-DNA insertional mutant. Schematic diagram for T-DNA insertion site in PhyB of Line 4A-02226 is shown (A). Black boxes represent exons; white boxes, UTR; lines between boxes, introns; gray triangle, T-DNA insertion; small arrows, gene-specific primers for qRT-PCR analysis and genotyping of tagged gene. ATG and TGA indicate start and stop codons. Scale bar = 800 bp. Genotyping was performed for phyB mutant line (B). Genotyping experiment identified homozygous progenies with T-DNA in PhyB. WT, wild-type segregants of T-DNA insertional line in PhyB; HO, homozygote; HE, heterozygote. Expression of PhyB was significantly suppressed in mutant (C). OsUBI5 (LOC_Os01g22490) was used as internal control. phyB homozygous progenies with T-DNA insertion demonstrated drought-tolerant phenotype. phyB and wild-type segregants grown in plastic pots for 4 weeks was exposed to water deficiency for 3 d. Photos were taken 7 d after re-watering (D–F). Scale bar = 10 cm. (G–J) shows the respective roots and dry weight. Scale bar = 5 cm. N = 3 for (D–I); n = 100 for (J).

