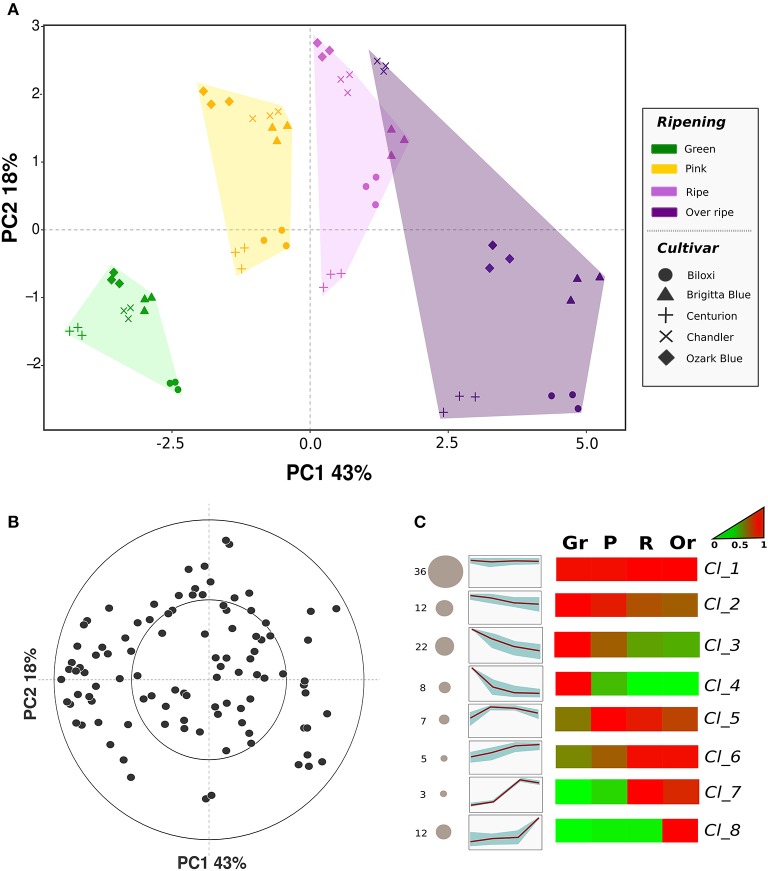
Figure 3.
Multivariate analysis of the blueberry VOC profile assessed by PTR-ToF-MS. Plot (A) depicts the VOC profile distribution of five blueberry cultivars at four ripening stages over the PCA score plot defined by the first two principal components. Plot (B) shows the projection of the VOCs identified by PTR-ToF-MS analysis (the high resolution vector form of the loading plot is illustrated in Supplementary Figure 4). Plot (C) reports the sorting of all compounds into eight significant clusters defined by SOTA (Self-organizing tree algorithm) analysis. Several additional information are reported next to each SOTA cluster: the number of compounds (number plus size of circle), heatmap and plot of compound fold changes among time series (normalized data to 0–1 range). Details about each SOTA cluster are reported into Supplementary Table 2.

