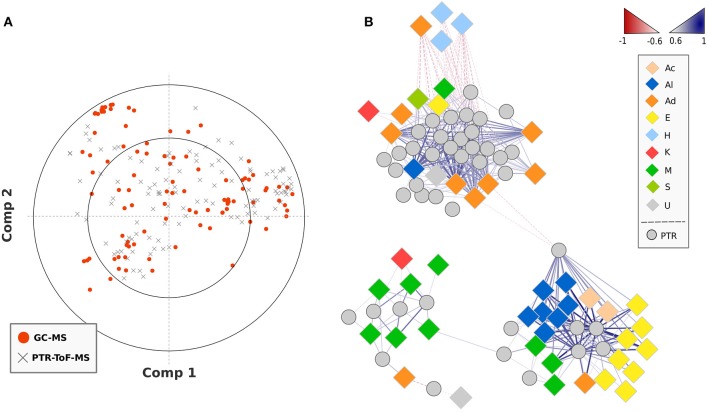
Figure 4.
PLS regression of VOC data obtained by SPME-GC-MS and PTR-ToF-MS analysis. Plot (A) reports the loading plot of the PLS regressions analysis assessed over the SPME-GC-MS and PTR-ToF-MS data. The plot (B) disclosed the correlation analysis network (CAN) built on significant (p < 0.01) PLS correlations between VOCs detected by SPME-GC-MS and masses quantified by PTR-ToF-MS. The gradient color coding of the edges, as well as the line thickness, denotes the level of correlation (0.6–1). Positive and negative correlations are shown by blue and red gradient color. The high resolution vector form of the correlation network is illustrated in Supplementary Figure 5.

