Figure 5.
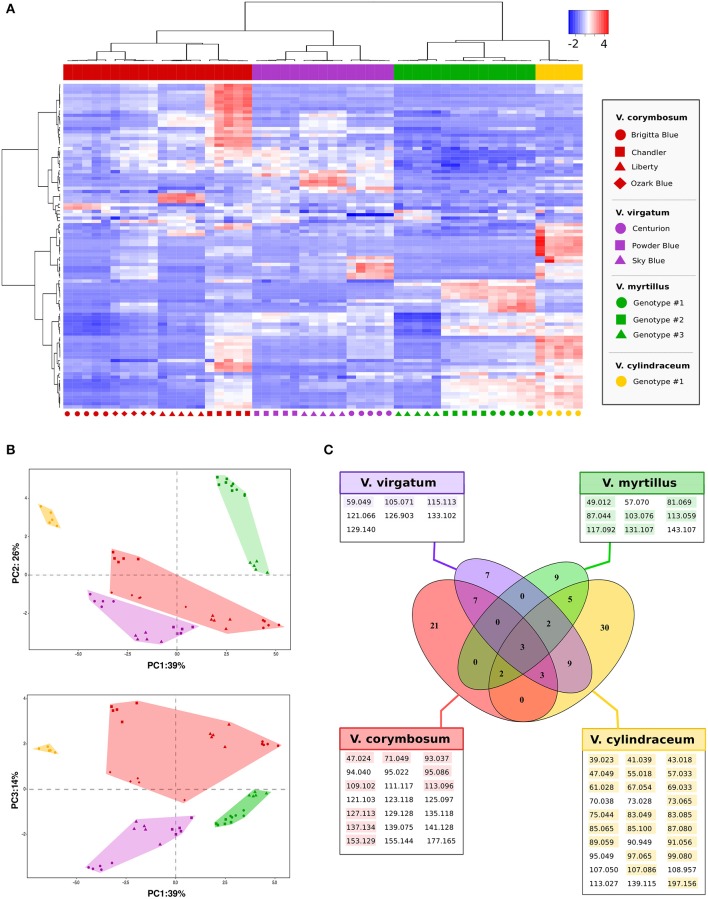
Multivariate VOC characterization of Vaccinium species by PTR-ToF-MS. Plot (A) represents the heat map and two dimensional hierarchical dendrograms of VOC assessed in 11 Vaccinium in five biological replicates. Cluster analysis was performed using Ward's method on centered and scaled data. Vaccinium accessions are grouped and clustered by columns, while VOCs are organized by rows. Plot (B) depicts the VOC profile distribution of the Vaccinium accessions over the PCA score plot defined by the first three principal components (loading plots of the PCA analysis are reported into Supplementary Figure 6). Symbols and colors refer, respectively, to the accession names and to the Vaccinium species reported in plot (A). In the Venn diagram, plot (C), the VOCs significantly (p < 0.01) more detectable in each Vaccinium species are grouped together (detailed ANOVA results are reported into Supplementary Table 3). For each species the significant m/z detected with a concentration higher than 2 ppbv are colourly highlighted.

