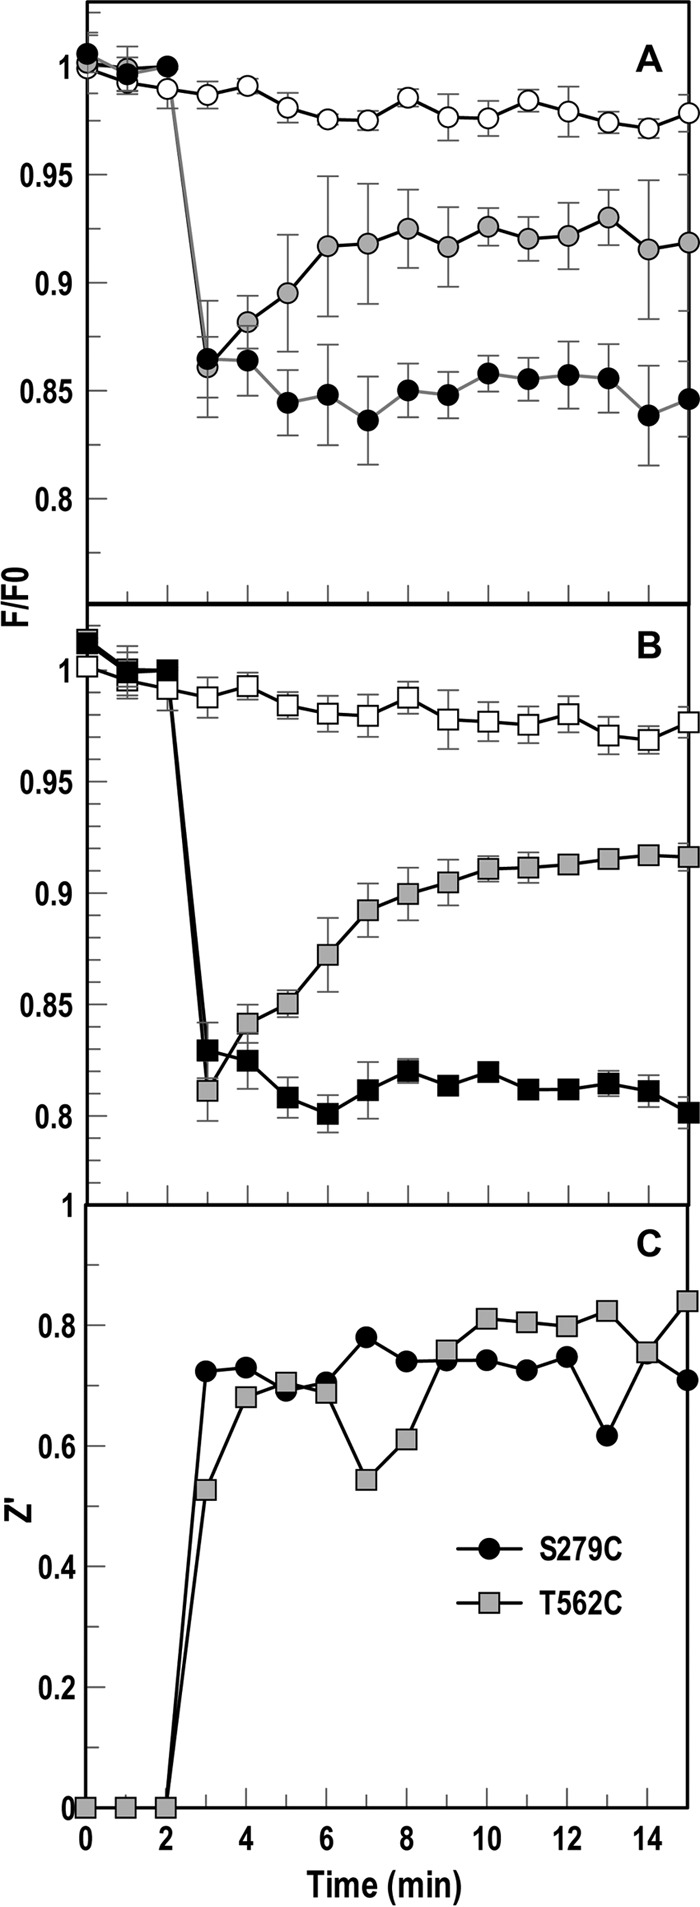
FIG 7.

Adaptation of fluorescence assay to HTS format in A. baumannii. We tested 17978 ΔfepA expressing AbaFepAS279C-FM, T562C-FM, and S665C-FM (not shown) in the fluorescence assay in a 96-well microtiter plate format. The tracings depict normalized fluorescence of FM-labeled ΔfepA/pAbafepAS279C (A) or T562C mutant (B) following exposure to 10 μM CCCP (negative control; filled symbols) or an equivalent volume of DMSO; open symbols. Following three readings of initial fluorescence (F0), we injected 20 nM FeEnt in the absence (gray symbols) or presence (filled symbols) of CCCP and measured changes in the ensuing fluorescence (F) over time. We also included cells to which no FeEnt was added (positive control; open symbols). The graph averages data from two separate experiments. (C) Z′ factors for each mutant's controls were calculated at each read during experiment, averaging between 0.6 and 0.8 for the controls from 8 to 15 min.
