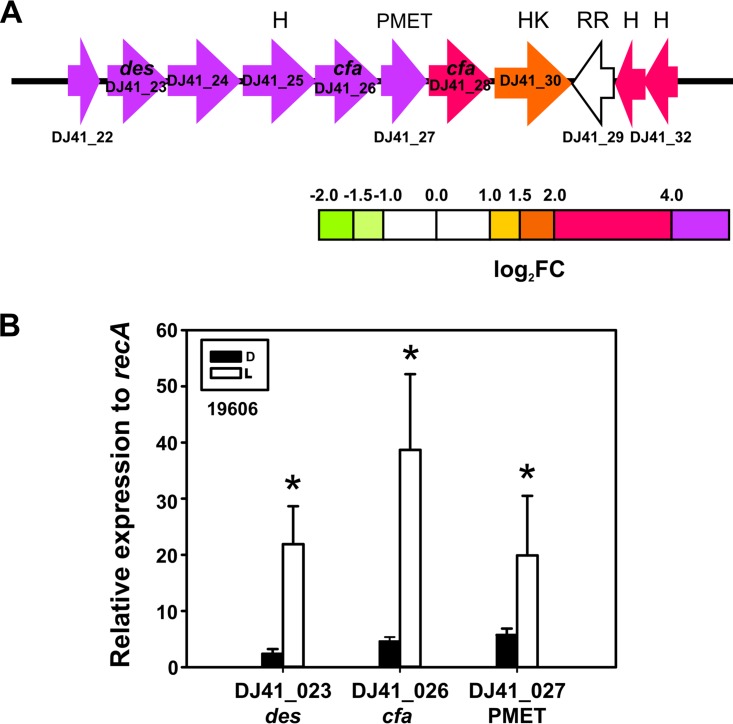
FIG 8.
Light induces a gene cluster coding for lipid modification enzyme cluster. (A) Schematic representation of the lipid modification enzyme cluster and the genes induced by light. Each arrow represents an individual gene to scale. The colors of the arrows represent relative degrees of differential gene expression under light versus darkness based on the color scale at the bottom. See the legend to Fig. 2 for further details. Gene products are as follows: des, estearoyl CoA 9-desaturase; cfa, cyclopropane fatty-acyl synthase; PMET, protein with phospholipid methyltransferase domain; HK, histidine kinase putative two-component system sensor protein (ColS-like); RR, putative effector domain in response regulator (ColR-like); and H, hypothetical protein. (B) Quantification of the expression levels of the indicated genes under blue light (L) or in the dark (D) in A. baumannii 19606, as determined by real-time qRT-PCR assays. The means of the results obtained using three independent cultures grown under blue light or in the dark are shown. The y axis refers to the fold difference of a particular transcript level relative to the CT values corresponding to recA; the SD is shown. Asterisks indicate significant differences among light and dark treatments, as indicated by t test (P < 0.05).

