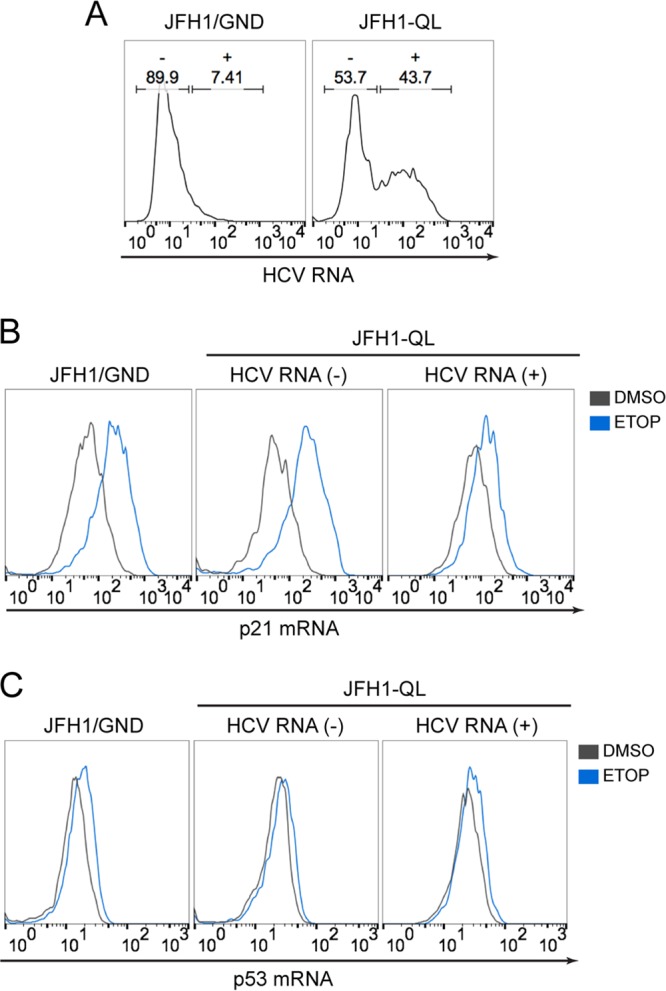
FIG 5 .

p21 and p53 transcript levels during HCV infection. (A) RNA flow cytometric analysis of HCV RNA-electroporated HepG2/miR-122 cells. Cells were gated into uninfected (-) versus infected (+) populations based on detection of HCV RNA. (B) p21 mRNA levels in cells without HCV RNA [HCV RNA (-)] versus cells with HCV RNA [HCV RNA (+)]. The cells were treated with 50 μM ETOP or DMSO control for 6 h. (C) p53 mRNA levels in HCV RNA (-) cells versus HCV RNA (+) cells treated as described for panel B.
