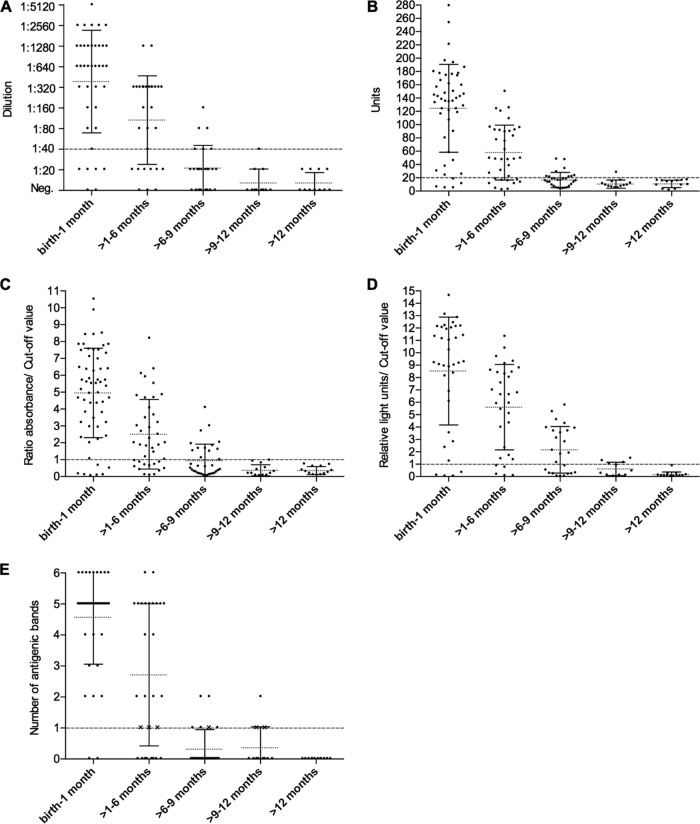
FIG 2.
Results obtained by each serological assay during the five follow-up periods of the noncongenital newborns: IFAT (A), ELISAc (B), ELISAr (C), CMIA (D), and WB (E). Dashed lines represent the cutoff values established for each test: 1:40 dilution for IFAT (A), 20 units for ELISAc (B), 1 absorbance/cutoff value for ELISAr (C), 1 relative light unit/cutoff value for CMIA (D), and a single band of the pattern (28, 32, 38, 39, 40, or 48 kDa) when it is as intense as the same band in the positive control for WB (E). Dotted lines indicate the mean of the results obtained in each period of the follow-up, and solid lines represent the standard deviation (SD). Crosses (X) in panel E indicate samples considered negative because they showed a band of the pattern but not as strong as in the positive control. Neg., negative.

