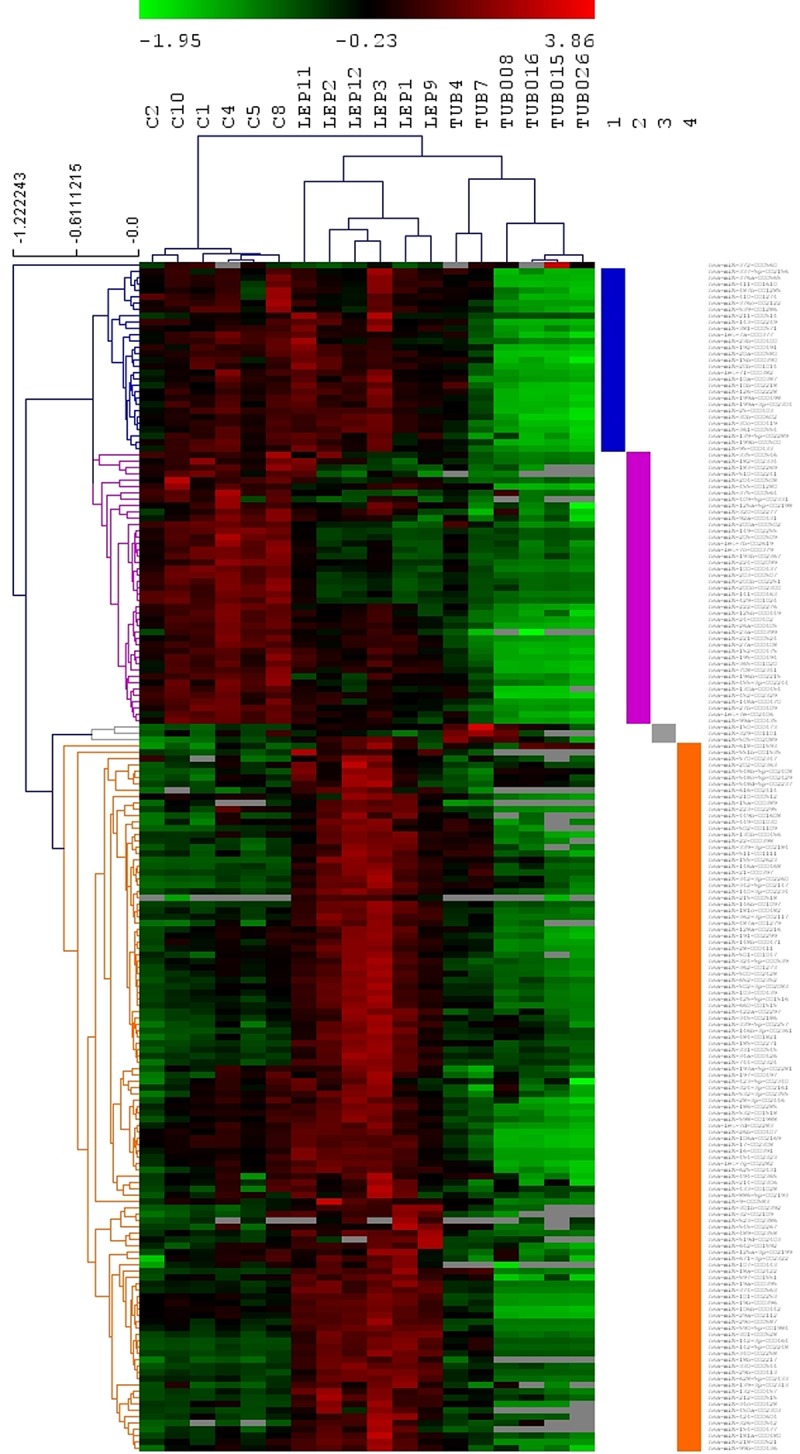
FIG 1.

miRNA expression profiles in leprosy patients and healthy controls. Hierarchical clustering analysis of miRNA expression data. Sample labels are on the top. C, healthy control; LEP, lepromatous; TUB, tuberculoid. On the right side, each of the four clusters are highlighted.
