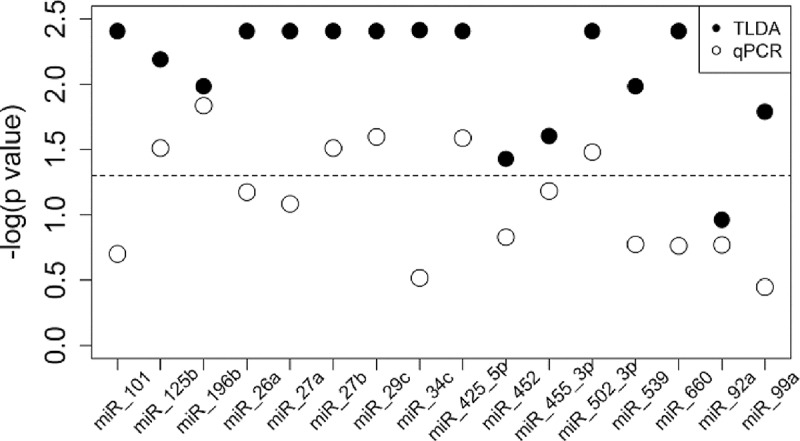
FIG 2.

miRNA expression median differences in TLDA and qRT-PCR experiments. Distribution of −log(P value) (Kruskal-Wallis) of comparison between miRNA expression median differences in the three groups (LL and TT patients and healthy controls). Filled circles represent TLDA experiments and unfilled circles represent qRT-PCR experiments. The dashed line indicates threshold of statistical significance (P value of 0.05). LL, lepromatous leprosy; TT, tuberculoid leprosy; TLDA, TaqMan low-density array.
