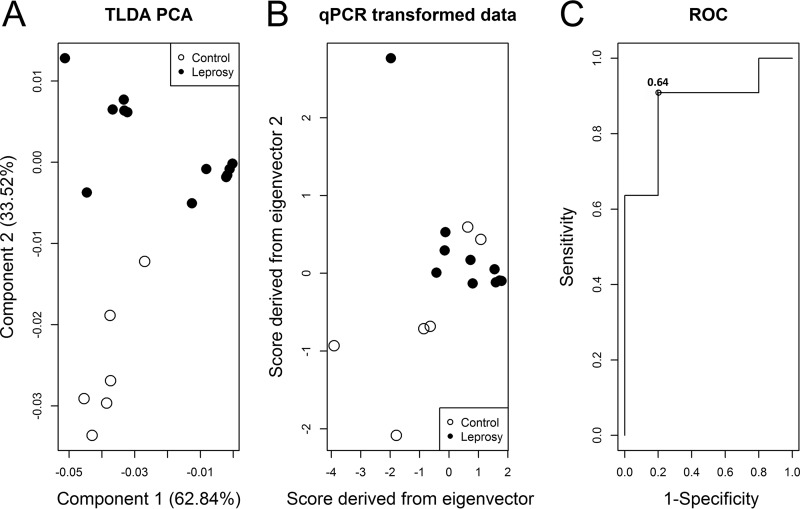
FIG 3.
Diagnostic power evaluation of miRNAs for discrimination between leprosy patients and healthy controls using a subset of four miRNAs. (A) Principal component scores of TLDA expression data of miR-101, miR-196b, miR-27b, and miR-29c indicate separation between the leprosy and healthy control groups. (B) Normalized eigenvectors were used to transform qRT-PCR data revealing a separation between the groups and high correlation of the data. (C) The first qRT-PCR-transformed score was evaluated in a ROC analysis after logistic regression revealing 100% sensitivity and 80% specificity with the cutoff of 0.64 and an AUC of 87.3% (95% CI, 66.8% to 100.0%) for discrimination of leprosy patients and healthy controls. TLDA, TaqMan low-density array.

