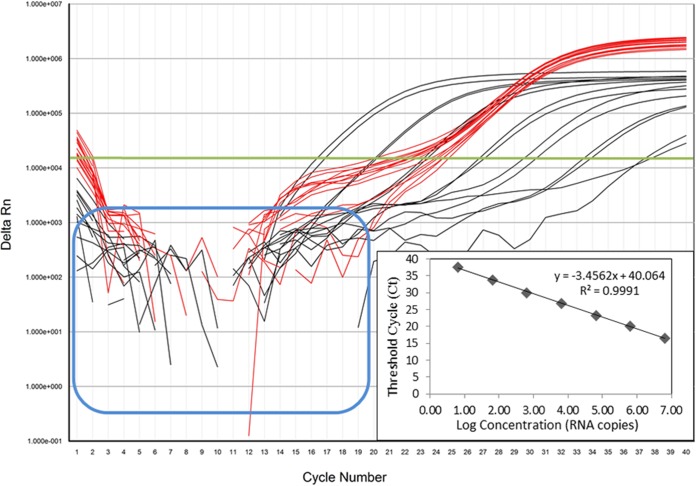
FIG 1.
Amplification curves of 10-fold dilutions of the RVA strain Wa dsRNA transcript spiked with MS2 bacteriophage RNA (from 6.5 × 10⁶ to 6.5 copies per reaction), obtained with the EMD Millipore NSP3 qRT-PCR assay. Using the threshold for delta Rn (the normalized reporter value [Rn] of the reaction minus the Rn of the baseline signal) (green line), black curves show the 10-fold dilutions of the NSP3 gene transcript and red curves show MS2 IPC amplification. The graph showing the CT value versus the log copy number was fitted with a regression line, and the slope for calculation of efficiency was obtained from the regression line. The fluorescent signals from RVA-negative samples and no-template controls are indicated by the blue outline.

