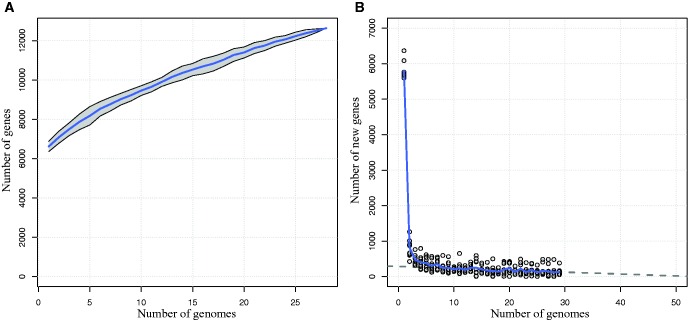
Fig. 4.—
Pan-genome size and new gene discovery in the pan-genome of Achromobacter xylosoxidans. (a) Twenty-nine genomes were randomly sampled 10 times and the number of genes present in the pan-genome was calculated for the first n genomes of each sample. The curve thus represents the mean of 10 independent observations. The grey area around this curve represents the standard deviation from the mean. (b) For each of the 10 samples described earlier, the number of new genes found in the pan-genome when an additional genome was added to the previous n−1 genomes (1≤n≤29) was plotted. The curve represents the mean of the 10 observations. Grey dots represent individual observations. The dashed line represents a linear fit to the nearly linear part of the curve (n≥10).

