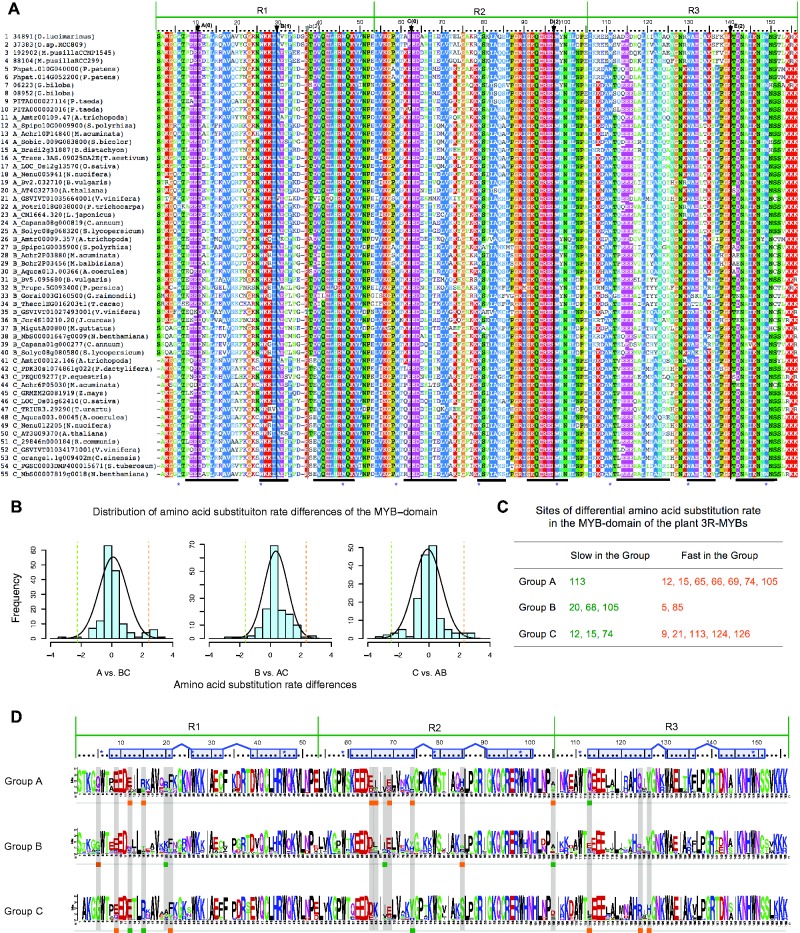
Fig. 4.—
Analysis of DNA binding domain of the plant 3R-MYBs proteins. (A) Alignments of DNA binding domain of representative plant 3R-MYB proteins. Protein groups (A-, B-, or C-) are indicated before of gene names and species are indicated inside brackets. The five conserved introns in the DNA-binding domain are indicated using black arrows, black lines, uppercase bold letters A, B, C, D and E; the other intron is indicated using gray arrow, gray line and lowercase letters b. The numbers in parentheses after the letter indicate intron position, with “0” indicates the introns between the two codons of the indicated two amino acids; “1” indicates the introns between the first and second nucleotide of the codon of the indicated amino acid; “2” indicates the introns between the second and third nucleotide of the codon of the indicated amino acid. Thick black lines at the bottom indicate the three helices in each R repeat (Ogata et al. 1992, 1994) and blue asterisks indicate the conserved tryptophans. (B) Distribution of the amino acid substitution rate differences comparing each group with the other two groups. Dashed lines indicate our threshold (2.57 SD) for the identification of rate shift sites. (C) The site in each group that has an unusually low (Slow in the Group) or high (Fast in the Group) amino acid substitution rate compared relative to the other two groups. (D) Amino acid alignment logos of the DNA-binding-domain of A-, B- and C-group 3R-MYBs with the slow (green) and fast (orange) sites highlighted. Blue boxes above the sequence logos indicate helices, blue lines between them indicate turns, and blue asterisks indicate the conserved tryptophans.

