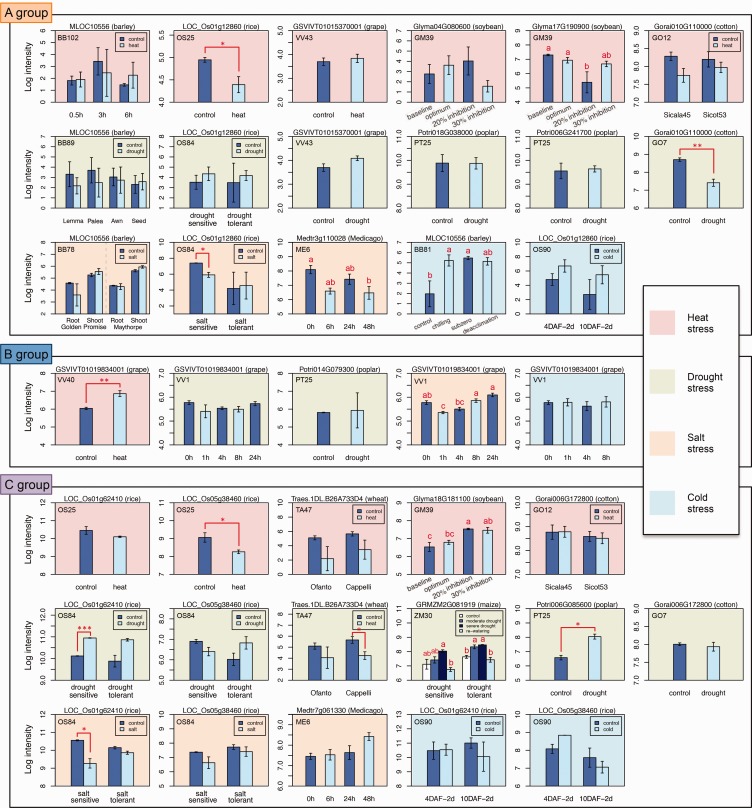
Fig. 9.—
Expression profiles of the 3R-MYB genes from nine angiosperm species under abiotic stresses. Labels in the upper left corner of each bar plot indicate microarray project accession number in PLEXdb (Dash et al. 2012). Please see detailed description of each experiment in PLEXdb (http://www.plexdb.org/index.php; last accessed March 31, 2017) under corresponding microarray project accession number. Error bars indicate SE. Asterisk(s) indicate significant level from two-sample t-test (significance level: *, 0.05; **, 0.01; ***, 0.001). a, b and c above each bar plot indicate difference significance by ANOVA and Tukey’s HSD test under 0.05 significance.

