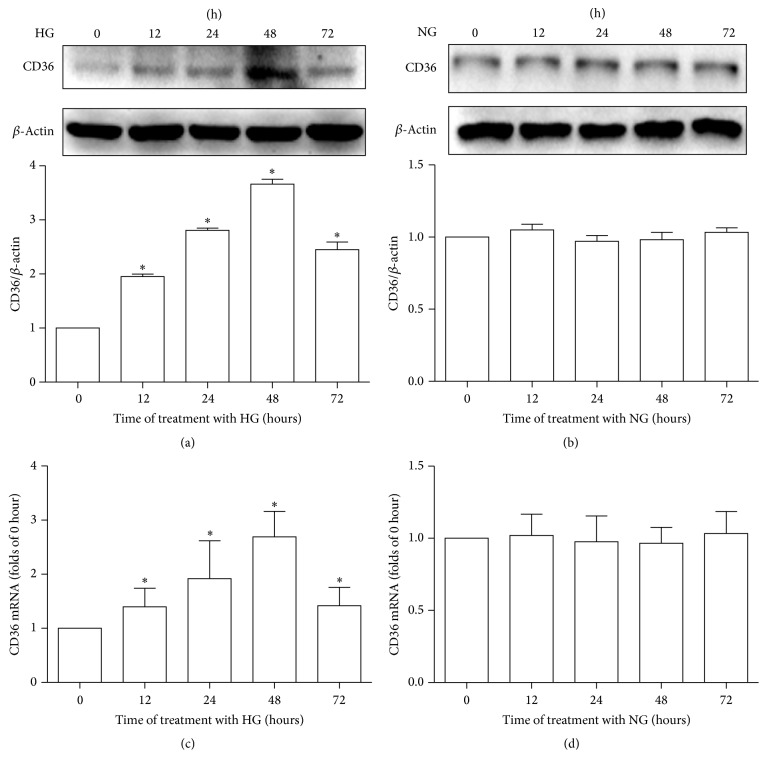
Figure 1.
Effects of high glucose or normal glucose on CD36 expression in HK-2 cells. HK-2 cells were treated with high glucose (30 mM, HG) or normal glucose (5.6 mM, NG) for 0 h, 12 h, 24 h, 48 h, or 72 h. The expression of CD36 was examined at the indicated time points in the HK-2 cells. All experiments were repeated thrice. CD36 protein levels were determined by western blotting. Band intensities were normalized to β-actin band intensity using densitometry. The data were represented as the means ± SD (a, b). CD36 mRNA levels were measured by RT-qPCR. β-Actin served as a reference gene. The data were represented as means ± SD (c, d). ∗P < 0.05 versus control (0 h).

