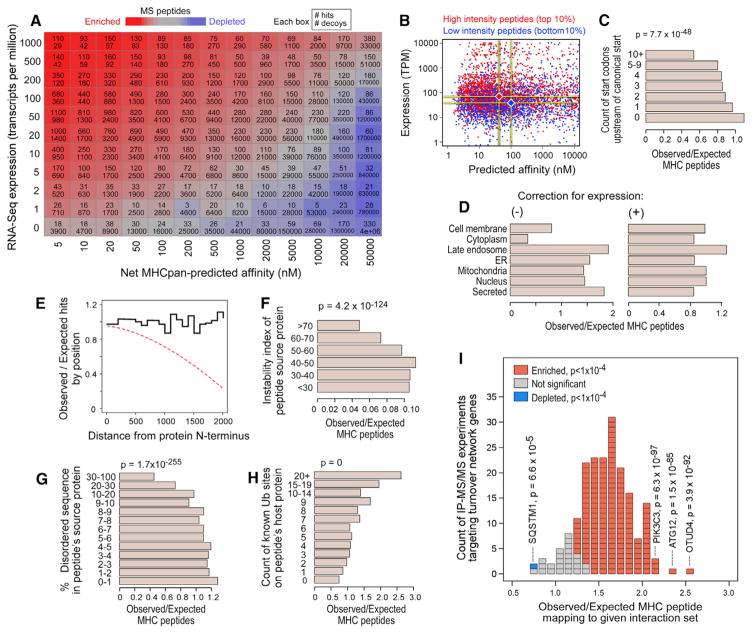
Figure 4. Evaluation of HLA-Peptide Characteristics that Impact HLA-Binding Predictions.
(A) Hits and decoys binned according to source transcript expression (per RNA-Seq; y axis) and predicted affinity (x axis) for each allele. Per bin, hit (top) and decoy (bottom) counts are reported. Color is according to the hit:decoy ratio (red = enriched for hits; blue = depleted of hits).
(B) MS peptides with high (red) and low (blue) MS1 ion intensities (top and bottom 10%, respectively), plotted by their NetMHCpan-predicted affinity and source transcript expression.
(C) Each LC-MS/MS-identified peptide was matched to ten random proteome 9-mer decoys with approximately equal expression but different source genes. The observed count of MS peptides divided by the expected count (based on decoy frequencies) is shown as a function of the number of upstream ATGs. P values were calculated by t test.
(D) The observed count of LC-MS/MS-identified HLA peptides mapping to each localization (Uniprot) relative to the expected count based on random 9-mer decoys (left) or expression-matched decoys (right).
(E) The ratio of observed to expected peptides at each distance lag from the source protein N terminus (blackline). The expected counts were determined under the assumption that each peptide was equally likely to have arisen from any position in its source protein. Frequent premature translation abortion would be expected to create an N-terminal bias (dashed red line).
(F) Observed versus expected HLA-peptide counts (determined from expression-matched decoys) as a function of source protein instability index (Guruprasad et al., 1990). P values were calculated by t test.
(G) Similar analysis to (F) showing enrichments as a function of the amount of intrinsically disordered sequence within each peptide’s source protein.
(H) Enrichments according to the count of ubiquitination sites, as previously observed (Krönke et al., 2015; Krönke et al., 2014; Udeshi et al., 2012), within the source protein.
(I) Approximately 200 protein-protein interaction experiments (Behrends et al., 2010; Christianson et al., 2011 Sowa et al., 2009), each yielding a set of 50–100 high-confidence interacting proteins for a given bait (usually a known protein-turnover-pathway gene) were scored according to their enrichment for LC-MS/MS-observed peptides, here depicted as a histogram. Each block corresponds to one experiment and is colored according to the directionality and significance (chi-square test) of the enrichment (see key). The bait protein used in outlier experiments (SQSTM1, PIK3C3, and OTUD4) is marked along with the corresponding p value. See also Figure S4.

