Figure 3.
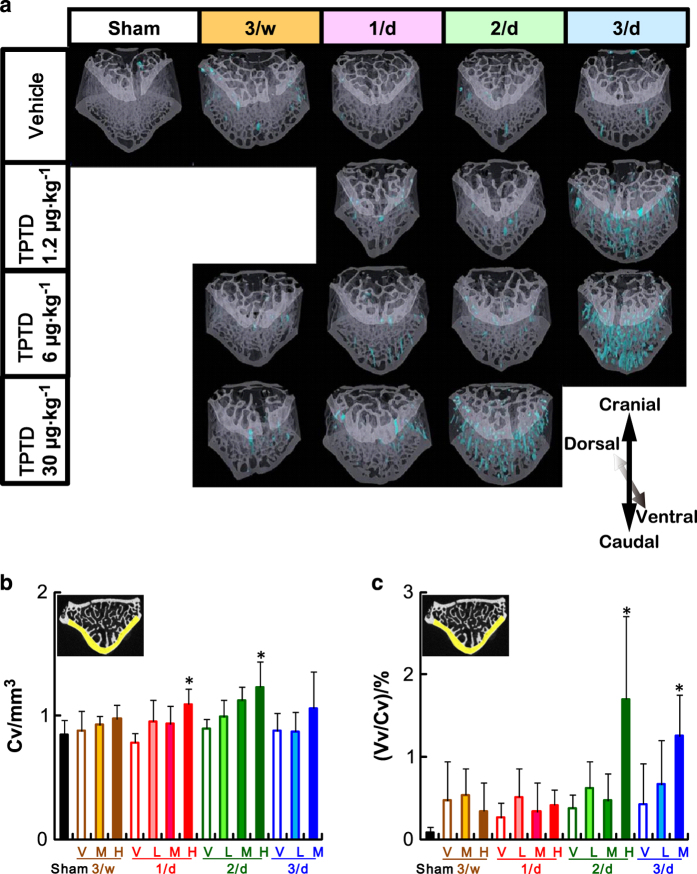
A micro-CT analysis of the cortical bone of LV4. (a) The three-dimensional reconstitution images of the bone structure of LV4. The region of cortical porosity is highlighted in blue. (b, c) Cortical bone volume (Cv) and (b) cortical void volume (Vv/Cv) (c) of ventral cortical bone of LV4 are plotted against the administration regimen of TPTD. The data are shown as the means+s.d. (n=4 or 5). * Indicates P<0.05 vs vehicle of each administration frequency (analysis of variance with post hoc Dunnett’s test). V: vehicle control, L: 1.2 μg·kg−1, M: 6 μg·kg−1, H: 30 μg·kg−1.

