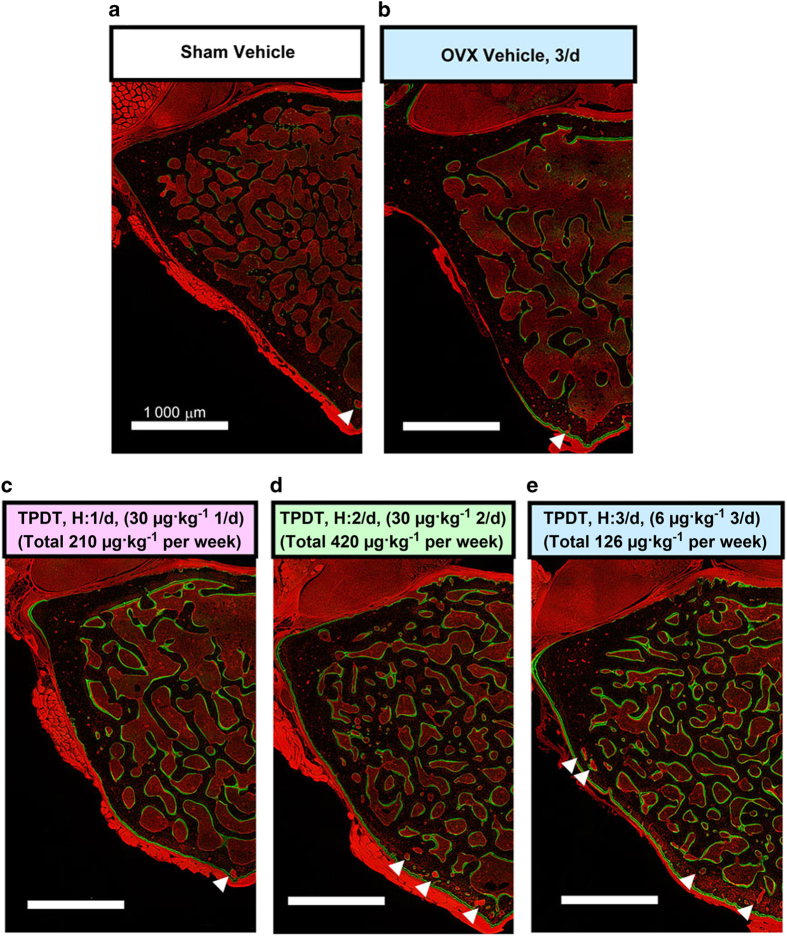
Figure 5.
Fluorescence tiling images with deconvolution fluorescence microscopy of transverse sections of the vertebral bodies obtained from specimens in the sham vehicle group, OVX vehicle group (V: 3/d), and 30 μg·kg−1 at 1 day (H: 1/d), 30 μg·kg−1 at 2 days (H: 2/d), and 6 μg·kg−1 at 3 days (M: 3/d) groups (a–e, respectively). The green fluorescence signal from calcein labeling demarcates active bone formation sites, whereas the auto-fluorescence signal derived from soft tissue provides morphological information. The white arrowheads indicate obvious intracortical bone resorption. Scale bars, 1 000 μm. Dorsal to up. The corresponding bright-field images with differential interference contrast (DIC) are shown in Supplementary Figure 4.

