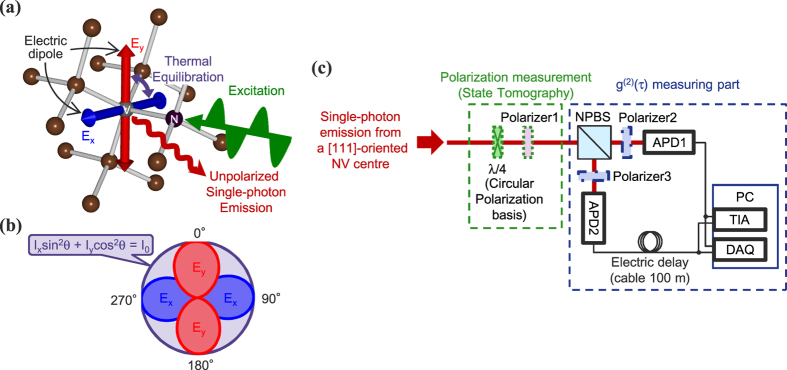
Figure 1. Structure of a [111]-oriented NV centre in diamond and experimental setup.
(a) Structure of a NV centre in diamond and electric dipoles Ex and Ey. (b) Schematic diagram depicting the unpolarized emission pattern (purple curve) caused by sum of emission from electric dipoles Ex (blue curve) and Ey (red curve) of a [111]-oriented NV centre. (c) The detection part of the experimental setup. For quantum state and process tomography, polarizer1 (purple rectangle) was inserted before a non-polarizing beamsplitter (NPBS). A λ/4 plate (green rectangle) was also inserted with its optic axis at 45° before the polarizer for measurement in the circular polarization basis. The setup for measurement of the second-order correlation function g(2)(τ) consisted of the NPBS, two avalanche photodiodes (APDs), a 100 m cable for electric delay and a time interval analyser (TIA). In other measurements, such as polarization angular dependences and tomography, pulses generated by APDs were counted by a data acquisition (DAQ) card. When we measured polarization correlations of the emitted single-photon stream, polarizer2, 3 (thick blue rectangles) were introduced between the NPBS and the APDs with HH, VV, HV and VH, where the first (second) character represents the polarization setting of polarizer2 (polarizer3).

