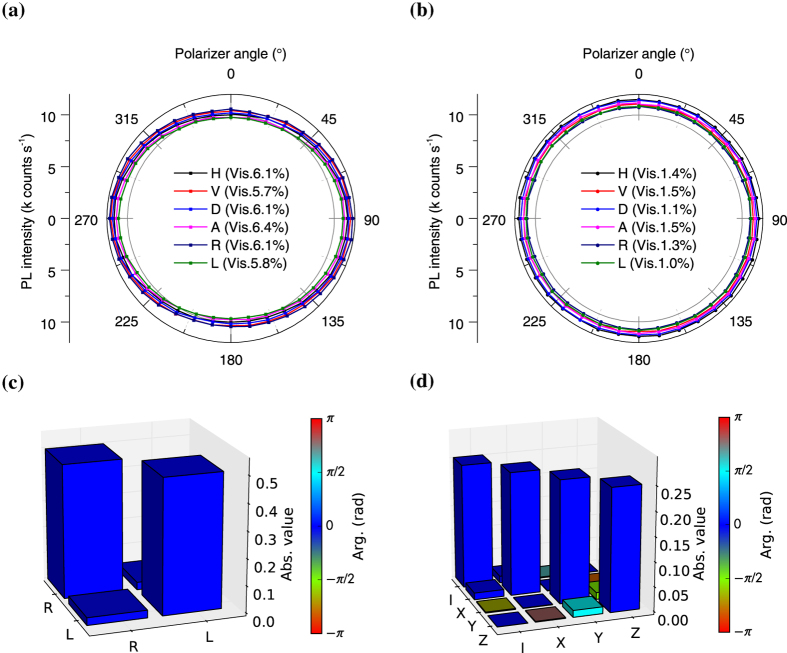
Figure 2. Polarization angular dependence and tomography.
(a) Linear polarization angular dependence of fluorescence intensity from a [111]-oriented NV centre when excitation laser polarization was set to be horizontal (H), vertical (V), diagonal (D), anti-diagonal (A), right circular (R) and left circular (L). Vis. indicates the visibility of each curve. (b) Circular polarization angular dependence of fluorescence intensity from the NV centre when the laser polarization was set to be the same as (a). (c) The reconstructed density matrix of the polarization state of single photons emitted from the NV centre by quantum state tomography. The height of the bars indicates the absolute value of elements of the matrix and the colour represents the phase. (d) The χ matrix estimated by quantum process tomography for the excitation-emission process, when the the input (output) state of the process is assumed to be the polarization state of the 532 nm excitation laser (single photons emitted from the NV centre). The height and colours of the bars indicate the same as in (c).

