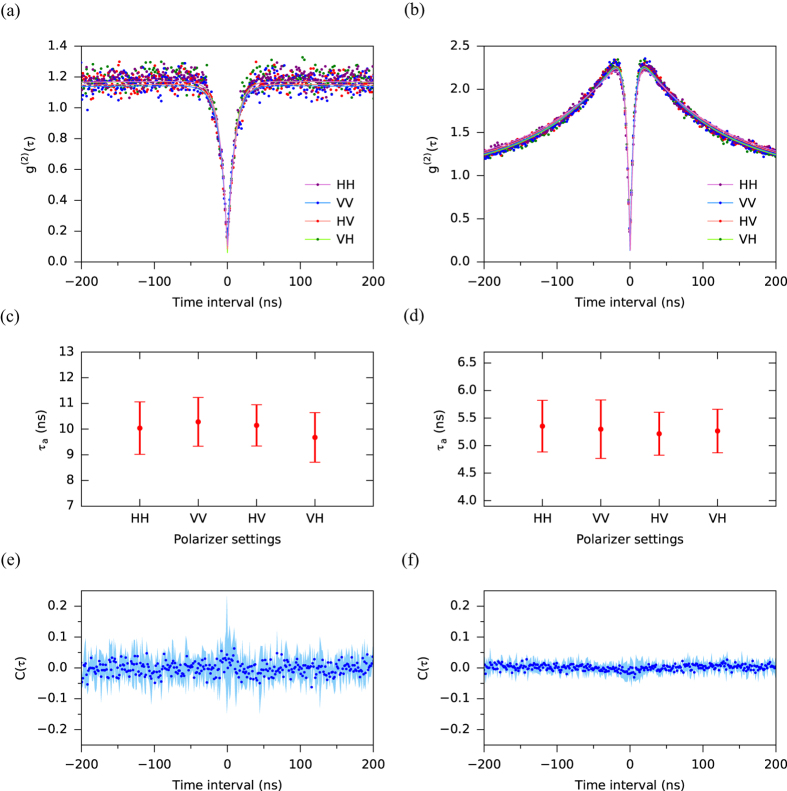
Figure 3. Polarization correlation measurements.
(a) The modified second order correlation function  . ij represents the polarizer settings HH, VV, HV and VH, where the first (second) character denotes the orientation of polarizer2 (polarizer3). The excitation power was set to be 0.20 mW (0.05Psat). The dots indicate the data and the lines indicate the fitting curves. (b) Same as (a) but for an excitation power of 8.8 mW (2.3Psat). (c) The decay times of anti-bunching estimated by fitting for the data shown in (a). The error bars indicate the standard error of the fitting parameter. Note that all points lie within the error bars of all the other points. This is convincing evidence of equivalence of the decay times. (d) Same as (c) but for the data shown in (b). (e) Polarization correlation function
  for the data shown in (a). The mean is 0.0008 and the standard deviation is 0.0206. (f) Same as (e) for the data shown in (b). The mean is 0.0022 and the standard deviation is 0.0109. The shaded areas in (e) and (f) indicate 90% confidence intervals.

