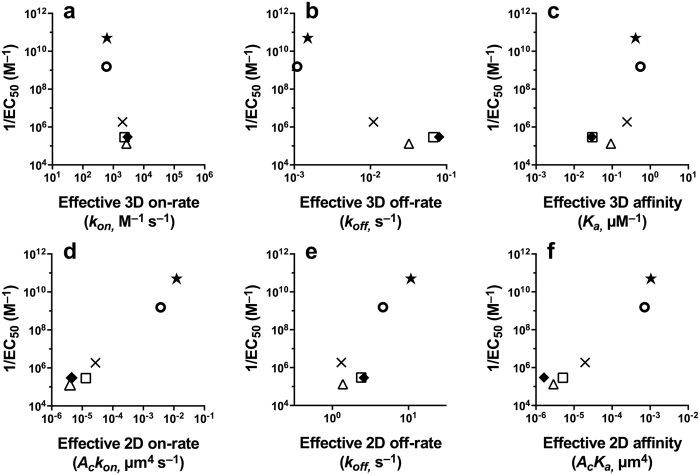
Figure 1. Correlation between T cell proliferation (potency), quantified through the value of 1/EC50, and TCR-pMHC effective kinetic parameters in 3D and 2D.
(a–c) pMHC functional potency versus TCR-pMHC 3D kinetics estimated with the surface plasmon resonance assay. (d–f) pMHC functional potency versus TCR-pMHC 2D kinetics estimated with the adhesion frequency assay. The data for the top row was adapted from refs 8,10, and data for the bottom row is based on ref. 10. Symbols correspond to the following ovalbumin-derived peptides (altered peptide ligands or APLs): ★, OVA; ⚪, A2; ×, G4;  , E1;
, E1;  , V-OVA;
  , R4.
, R4.

