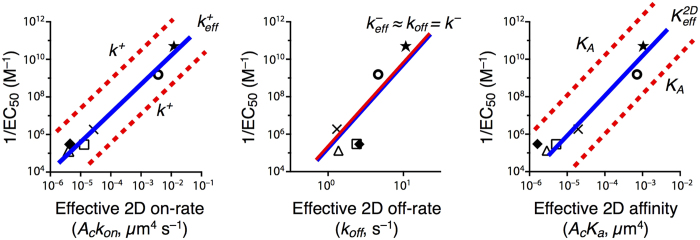
Figure 4. Observed and expected trend lines between T cell functional output and effective (AF assay-derived) and fundamental kinetic constants for the set of peptides used in Fig. 1.
The blue solid lines correspond to the effective kinetic constants,  ,
,  ,
,  and
and  , as determined with the AF assay and the SS model. The red lines correspond to the fundamental binding constants (k+, k− and KA). A dashed red line indicates an uncertainty in the direction and magnitude of the shift corresponding to a given fundamental binding parameter, depending on whether
  is positive or negative and whether
  is relatively large or small. See details in Cases 1, 2 and 4.

