
Figure 3.
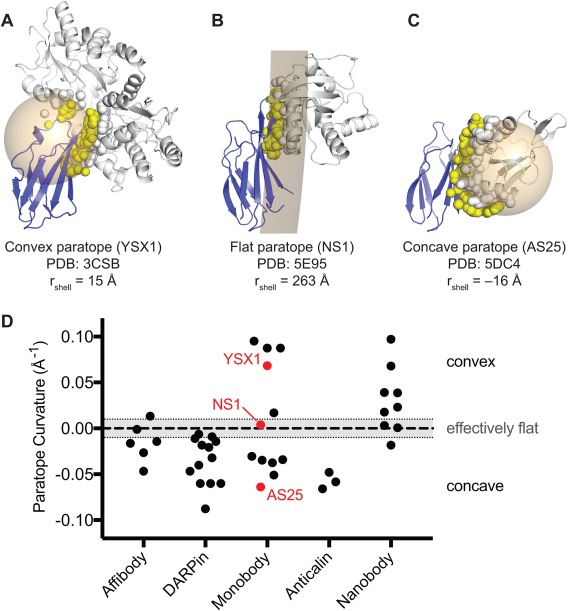
Concavity analysis of binding protein‐target interfaces. (A–C) Three representative structures of Monobody‐target complexes with different levels of concavity. For each crystal structure, a spherical shell (tan) was fit to all the atoms that compose the target‐contacting residues on the Monobody (i.e., the paratope; yellow spheres). A spherical shell with a large radius approximates a flat interaction. Spherical shells with smaller radii, centered within the Monobody or target represent convex or concave paratopes, respectively. To distinguish between the two orientations, the radii of shells corresponding to concave paratopes were assigned negative values. Monobody and target structures are shown as blue and gray cartoons, respectively. Atoms composing the Monobody‐contacting residues on the target (i.e., the epitope) are shown as gray spheres. (D) Concavity analysis on 34 synthetic binding protein‐target complex structures from the PDB. Nanobody complexes are also included for comparison. Curvature is defined as the inverse of the radius of the spherical shell as described above. An arbitrary threshold of |rshell| ≥ 100Å (|curvature| ≤ 0.01 Å−1) was defined as an effectively flat interface.