
Figure 3.
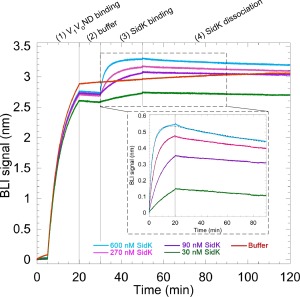
Biolayer interferometry with V 1 V 0ND. 5 μg/mL of biotinylated V 1 V 0ND was used to load streptavidin sensors (step 1) followed by dipping the sensors in buffer (step 2). The sensors were then dipped into wells containing either buffer, 30, 90, 270, or 600 nM of GST‐tagged SidK to measure association rates (step 3). All the sensors were then dipped into buffer containing wells to measure dissociation rates (step 4). GST‐SidK showed concentration dependent interaction with V 1 V 0ND as evident from the association and dissociation phases (enlarged box). The signal obtained in buffer (red) was subtracted from the GST‐SidK signal and the resultant curves were globally fit to a one site binding equation (black dotted traces). The on rate was found to be 1.25 × 10⁴ ± 19 s−1 and the off rate was 4.4 × 10⁻⁵ ± 9.7 × 10⁻⁸ s−1, resulting in a K d of ∼3.5 nM. Representative experiment from two repeats is shown.