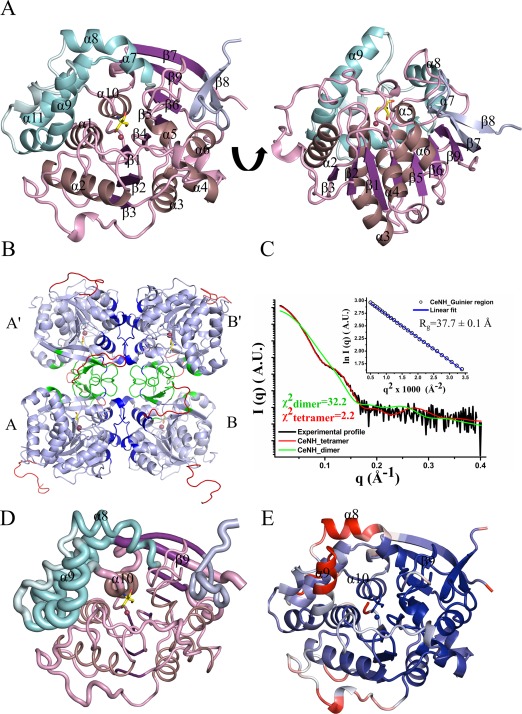
Figure 1.

Crystal structure of CeNH. (A) Top and side view of a CeNH subunit in cartoon representation. The central core of the structure is colored in different shades of purple, with α‐helices colored violet, β‐strands colored purple and coils colored pink. The α‐helices of the helical bundle are colored cyan with the intervening loops colored pale cyan. The β‐strand insertion is shown in light blue. A Tris molecule and Ca2+‐ion bound to the active site are shown as yellow sticks and as a red sphere, respectively. (B) Homotetramer assembly of CeNH obtained from crystal symmetry operation. Subunits are indicated with A and B and their symmetry variants with A' and B'. Regions forming the A‐B or A'‐B' interface are shown in dark blue; regions forming the A‐A' or B‐B' interfaces are shown in green. The missing residues in the crystal structure were modeled using MODELLER and are shown in red. (C) Superposition of the experimental SAXS trace (black) on the theoretical SAXS profiles calculated from the CeNH tetramer (red) and the dimeric CeNH arrangement found in the asymmetric unit (green) using CRYSOL. The inset figure shows the linear Guinier region for the experimental SAXS profile. (D) A “Sausage” representation of CeNH that maps the rmsd deviation per Cα atom after superposition of CeNH on all NH structures available in the PDB (using ENDscript36). The thickness of the tube is proportional to the mean rmsd per residue. The color coding is similar to (A). (E) Cartoon representation of a CeNH subunit colored based on the B factors. The regions with a blue color are the residues with low B factor while the regions with a red color represent residues with high B factors. Gray colored regions have intermediate B factors.
