
Figure 3.
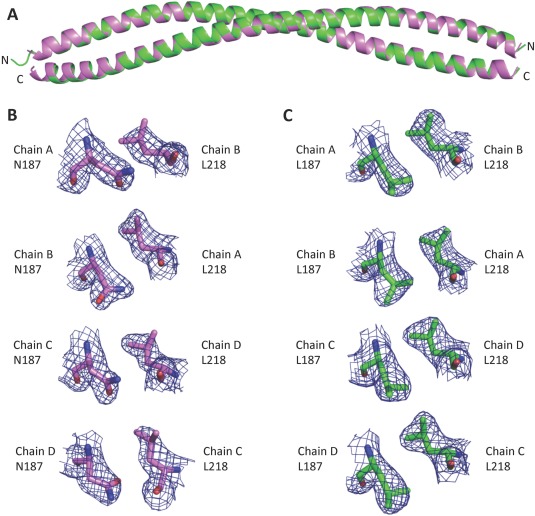
Superposition of WT and N187L BECN2 CCD structures. (A) Superposition of the N187L mutant (green) and WT (violet) BECN2 CCD homodimers. (B) Atomic details of N187–L218 pair in the WT BECN2 CCD structure for each chain. The 2Fo–Fc electron density maps are contoured at 1σ above the mean (blue mesh). (C) Atomic details of L187–L218 pairs for each chain in the N187L BECN2 CCD structure. The 2Fo–Fc electron density maps are contoured at 1σ above the mean (blue mesh).