Figure 4.

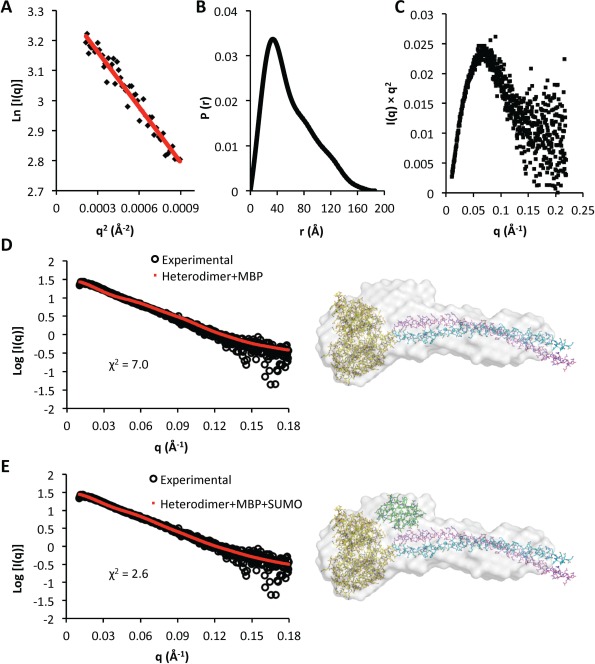
SEC‐SAXS analysis of SUMO‐His6‐BECN2:MBP‐ATG14 CCD heterodimer. (A) Guinier plot for the region s × R g ≤ 1.3. (B) P(r) pairwise distribution. (C) Kratky plot. (D and E) The fits of theoretical scattering profiles (red dots) calculated from the corresponding heterodimer model to the experimental SAXS data (black circles) are shown on the left. The pseudo‐atomic BECN2:MBP‐ATG14 CCD heterodimer models are (D) without SUMO‐His6 and (E) including SUMO‐His6 (right panels). The ab initio calculated molecular envelope is shown in gray. The atomic structures used for constructing the heterodimer model construction are shown in atomic detail with carbons colored according to molecule: MBP, yellow; SUMO, green; BECN2 CCD, violet; and ATG14 CCD, cyan (An interactive view is available in the electronic version of the article).
