
Figure 5.
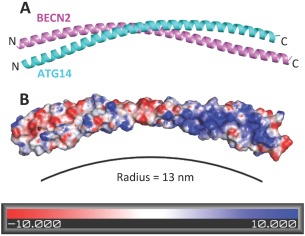
The BECN2:ATG14 CCD heterodimer. (A) The predicted heterodimer model displayed as (A) ribbon with BECN2 in violet and ATG14 in cyan ribbon and (B) molecular surface colored according to electrostatic potential calculated using APBS.
Official websites use .gov
A
.gov website belongs to an official
government organization in the United States.
Secure .gov websites use HTTPS
A lock (
) or https:// means you've safely
connected to the .gov website. Share sensitive
information only on official, secure websites.
The BECN2:ATG14 CCD heterodimer. (A) The predicted heterodimer model displayed as (A) ribbon with BECN2 in violet and ATG14 in cyan ribbon and (B) molecular surface colored according to electrostatic potential calculated using APBS.