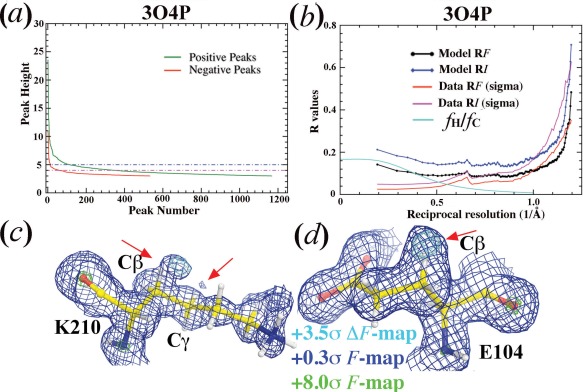
Figure 5.

Analysis of diisopropyl fluorophosphatase model at 0.85‐Å resolution (3O4P).11 (a) Residual positive (green) and negative (red) peaks as a function of peak number. (b) Model (black and blue) and data (red and magenta) R‐factor on intensity or amplitude as a function of reciprocal resolution (1/Å). Estimated contribution of H atoms to the total structure factor is shown in cyan curve. (c,d) σ A‐Weighted F (contoured at 0.3σ, blue, and 8σ, green) and ΔF (contoured +3.5σ) maps for K210 (c) and E104 (d). Arrows indicate likely partial additions of O atoms.
