
Figure 2.
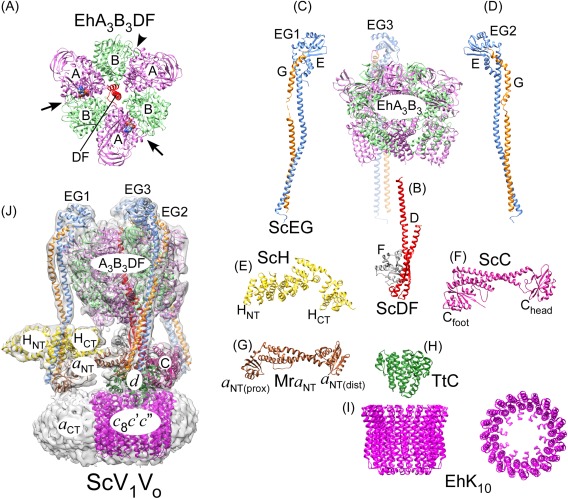
Overall subunit architecture of holo V‐ATPase. (A) Crystal structure of EhA3B3DF (3vr6; a side‐view of the structure is also shown on the right).47 The arrows indicate closed catalytic sites with AMPPNP bound and the arrowhead points to the open site. (B) Crystal structure of ScDF (4rnd).48 (C,D) Crystal structures of ScEGChead in two conformations (4dl0, 4efa; Chead not shown).49 (E) Crystal structure of ScH (1ho8).50 (F) Crystal structure of ScC (1u7l).51 (G) Crystal structure of the a NT homolog from M. ruber (Mra; 3rrk).52 (H) Crystal structure of the d homolog from T. thermophilus (TtC; 1r5z).103 (I) Crystal structure of the proteolipid ring from E. hirae (EhK10; 2bl2)53. (J) CryoEM map of ScV1Vo (emd‐6284)45 with fitted coordinate models of individual subunits and subcomplexes (3j9t).45 The overall model was generated from individual crystal structures of yeast subunits and homology models generated by threading yeast primary sequences into crystal structures of bacterial A‐ATPase subunits.