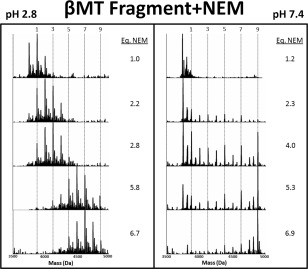
Figure 2.

Representative deconvoluted ESI‐MS spectra from the stepwise modification of the βMT fragment by NEM. The extent of the modification in terms of number of covalent NEM modifications on the MT is shown by the vertical lines for the 1, 3, 5, and 9 NEM bound masses. Note that the apo‐fragment is not indicated, its mass lies to the left of the “1” line. The fully modified fragment is indicated by the “9” line. The number of molar equivalents of NEM added in the stepwise titration is listed to the right of each panel up to 8.8. The NEM was added stepwise with the mol eq as shown to the right of each panel at pH 2.8 (left panel) and pH 7.4 (right panel).
