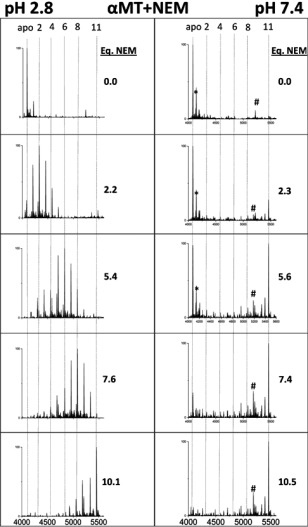
Figure 4.

Representative deconvoluted ESI‐MS spectra of the modification of α‐MT fragment with NEM. The extent of the covalent NEM modification (0 −11) is shown by vertical lines (apo (0), 2, 4, 6, 8, and 11). NEM was added stepwise, with the molar equivalents added shown to the right of each panel, at pH 7.4 (left panel) and 2.8 (right panel). *‐+60 Da adduct, #‐unknown contaminant at 5183 Da not corresponding to MT or any modified species.
