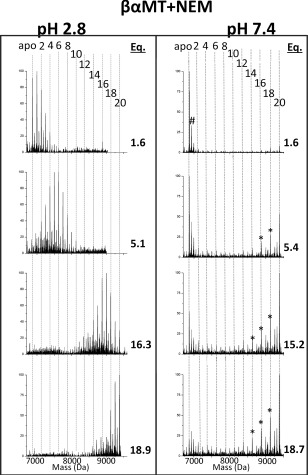
Figure 5.

Deconvoluted mass spectra of NEM modifications of βα‐MT under native (pH 7.4, right) and denaturing (pH 2.8, left) conditions. The masses and numbers of the covalent modifications are shown by the vertical lines 0 (apo)−20. The mol. eq. of NEM reacted are shown to the right of each spectrum. *‐indicates the presence of partially oxidized MT species #‐+60 Da adduct.
