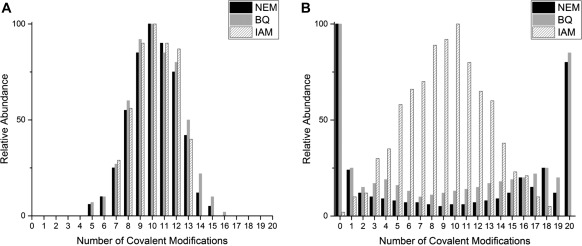
Figure 7.

Comparison of the reaction profiles shown by the relative abundances of each modified βαMT‐species at approximately the halfway point, for the three cysteine modifiers used. (A) Relative abundances under denaturing conditions at pH 2.8–3.0 and (B) relative abundances under native conditions at pH 6.8–7.4. The relative abundances shown in this figure were extracted from raw deconvoluted ESI‐MS data at approximately 10 mol. eq. of each modifier.
