
Fig. 5.
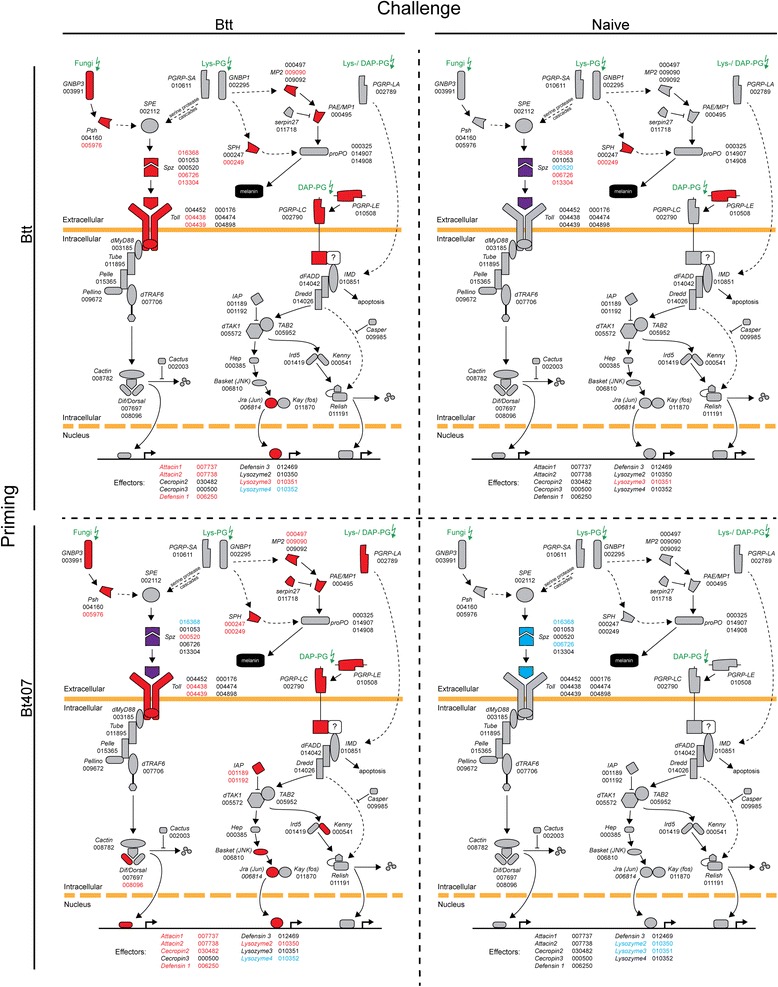
Regulation of the Toll and IMD pathway in relation to priming and challenge treatments. Illustrated are the Toll and IMD pathways after Zou et al., [26] for the two priming treatments, 6 h after the challenge with Btt spore-contaminated or naïve diet (flour + PBS). Red color indicates significant upregulation, blue significant downregulation of the respective genes and purple both, significant up- and downregulated genes in the case when genes from the same gene family were reversely expressed. The corresponding official gene IDs (‘TC######’) are specified next to the genes. For effectors, only those that are differentially expressed 6 h after the challenge treatment (Btt or naïve) in at least one treatment are indicated with their respective official gene IDs