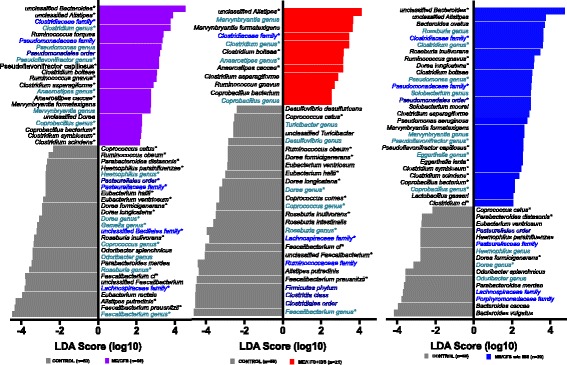
Fig. 3.

Bacterial taxa differentiate ME/CFS and ME/CFS subgroups (ME/CFS + IBS and ME/CFS without IBS) compared to controls. Histogram showing the log-transformed LDA scores computed with LEfSe for bacterial taxa differentially abundant between ME/CFS groups and controls. Positive LDA score indicates enrichment in a ME/CFS, b ME/CFS + IBS, and c ME/CFS without IBS vs. controls. Negative LDA indicates enrichment in control subjects (reduced in ME/CFS subgroups). The LDA score indicates the effect size and ranking of each bacterial taxon. Names of different taxonomic categories (genus, family, or order) are indicated with shades of blue; species names are written in black. An alpha value of 0.05 for the Kruskal-Wallis test and a log-transformed LDA score of 2.0 were used as thresholds for significance in LEfSe analyses. Asterisks next to taxa names indicate significant differences that were also found for a given taxa based on nonparametric Mann-Whitney U test with Benjamini correction (adjusted p < 0.2)
