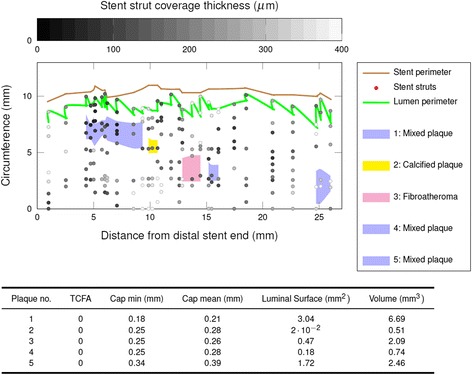
Fig. 2.

Schematic illustration of sub-strut plaque distribution in an analyzed coronary segment as spread-out vessel chart. The investigated vessel segment is displayed longitudinally bisected and unfolded: Stent struts are displayed as grey dots according to their degree of stent incorporation in the vessel wall (neointimal thickness: grey color bar). Polygones display luminal surface plaque areas of five different identified sub-stent plaques (pink = fibroatheroma, yellow = calcified plaques blue = mixed plaque). X-axis = stent length, y-axis = stent circumference. Corresponding measurements including cap thickness, “luminal” surface area and volume of each plaque are given in the table below
