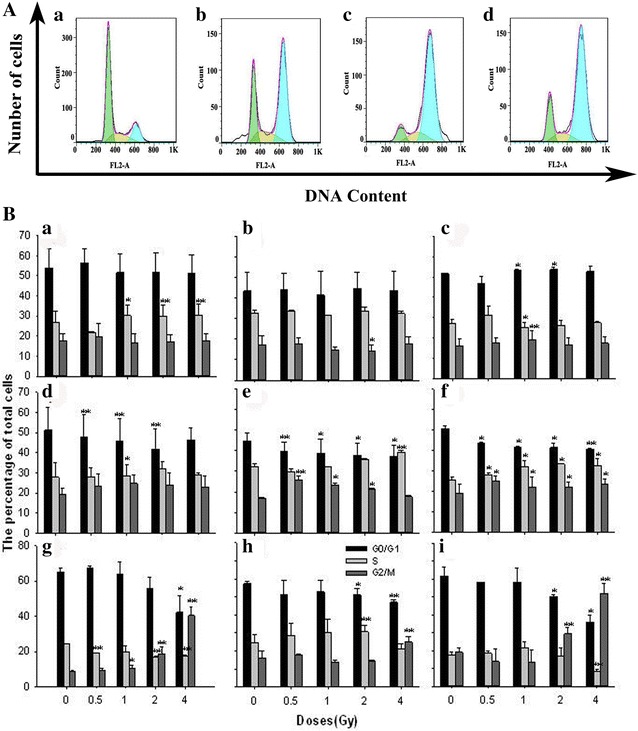
Fig. 7.

A Cell cycle distribution of three cell lines. a-Hela, HepG2 and MEC-1 cell are treated with 4 Gy 12C6+ followed incubation for 24 h. a Control (Hela cells), b Hela cells, c HepG2 cells, d MEC-1 cells. B Three cell lines treated with 0.5, 1, 2 and 4 Gy 12C6+ irradiation and subsequently incubated for 0.5, 4 and 24 h. a, b, c 0.5 h; d, e, f 4 h; g, h, i 24 h. a, d, g Hela cells; b, e, h HepG2 cells; c, f, i MEC-1 cells. *P < 0.05, **P < 0.01 vs Control. Results are the means and SD for the three experiments
