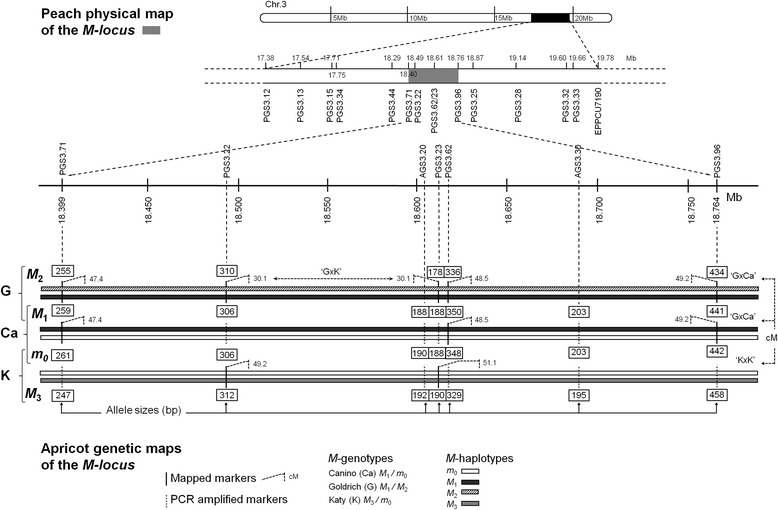
Fig. 1.

Apricot M-locus haplotypes structure. The peach syntenic region at the distal end of chr. 3 (black box) comprising the M-locus (grey box) is zoomed twice and shows SSRs (dashed lines) PCR-amplified in apricot cultivars ‘Goldrich’ (G), ‘Canino’ (Ca) and ‘Katy’ (K). SSR positions in peach genome (Kb) and allele sizes (bp) determined in apricot are indicated. White, black, diagonal striped and grey thick lines represent apricot m 0, M 1, M 2 and M 3 haplotypes, respectively. SSR anchoring positions are shown in centimorgans (cM) (boxed numbers) according to the available mapping populations (‘G × Ca’, ‘K × K’ and ‘G × K’)
