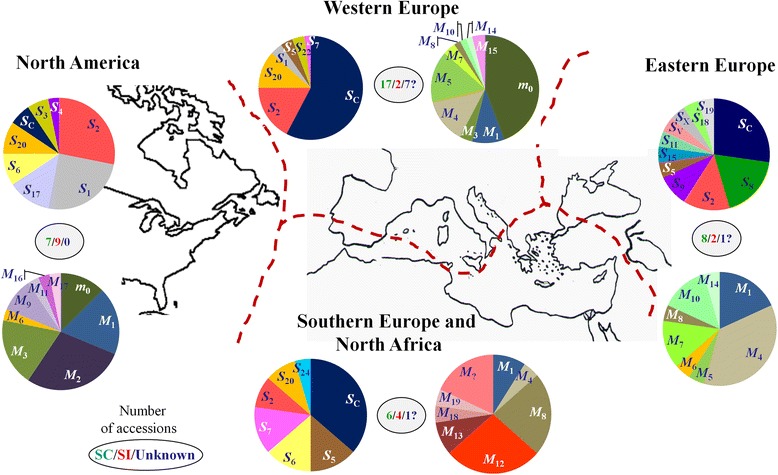
Fig. 2.

S- and M-locus haplotypes distribution according to geographic areas. Apricot accessions analyzed in this study were grouped in four arbitrarily defined geographic areas represented by the bottom map: Western Europe (WE), North America (NA), Southern Europe and North Africa (SE/NAf) and Eastern Europe (EE). Accordingly, relative frequencies for S- and M-haplotypes (pie charts) are shown for each area (clonal sibs from ‘Canino’ were excluded from estimations). For the sake of simplicity M-locus haplotypes are represented in their ‘main classes’. Question marks (?) designate not defined haplotypes. Number of accessions showing self-(in)compatible phenotype are encircled (green color means SC, red SI and blue undetermined phenotype)
