Fig. 8.

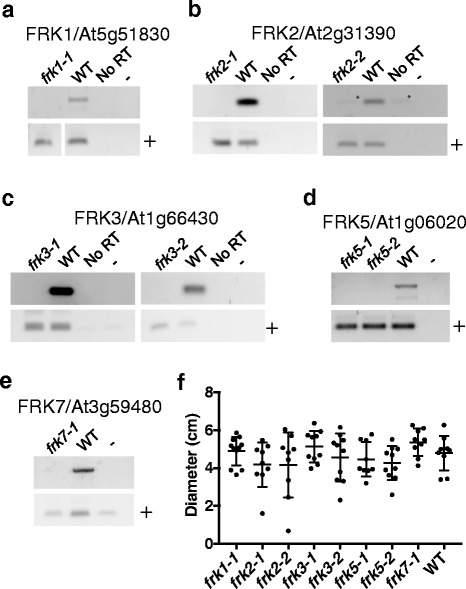
Single T-DNA insertional mutants exhibit no growth phenotype. RT-PCR results on cDNAs generated from seedling mRNA using primers flanking the T-DNA insertional site for (a) frk1–1, (b) frk2–1 and frk2–2, (c) frk3–1 and frk3–2, (d) frk5–1 and frk5–2, and (e) frk7–1 and Col-0 (WT). Primers specific to another unrelated pfkB family member were also used in all cases to verify presence of cDNA in all reactions, denoted as +. F. Scatterplot of plant diameters at 21 days of growth. Measurements were made in ImageJ and plotted in Prism. Growth experiments were repeated twice with the exception of frk5–2, which was repeated once. All data points are shown from one representative experiment, the independent experiment gave the same result. ANOVA analysis was carried out in Prism. There were no statistical differences between any of the rosette diameters
