
Fig. 3.
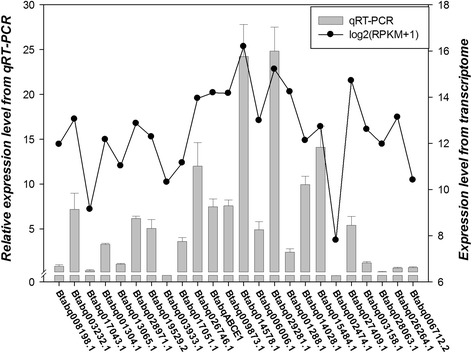
mRNA expressions of selected B. tabaci Q ABC transporters by RT-qPCR. The bars represent expression level of B. tabaci Q ABC transporters relative to the Btabq008198.1. Data are presented as means ± SE. Spots indicated log2 (RPKM + 1) values of ABC transporters in adults. Significant correlation between RT-qPCR and transcriptomic analyses were assessed by SPSS