Fig. 2.

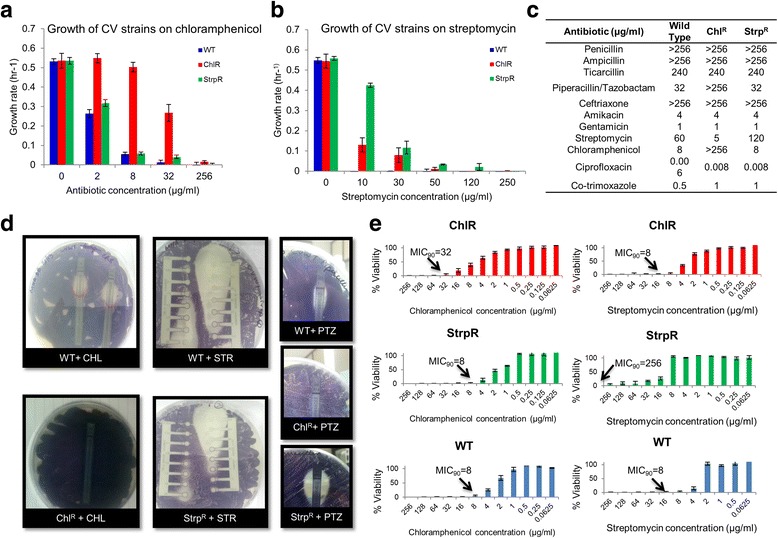
The evolved phenotypes of antibiotic resistance: Growth profiling and minimum inhibitory concentration typing across sensitive and resistant populations. a Growth rate on varying concentration of chloramphenicol showing a 17 and 7 fold change relative to wild type at 32 μg/mL for ChlR and StrpR respectively. b Growth rate on varying concentration of streptomycin showed no growth for WT and ChlR at 30 μg/mL and considerable growth rate for StrpR. c MIC using EzyMICTM Strips for 11 antibiotics. d Mueller Hinton agar plates showing primary resistance against chloramphenicol (Chl) and streptomycin (Str) and secondary resistance developed against piperacillin/tazobactam (PTZ). ChlR shows no zone of inhibition contrary to an elliptical zone of inhibition in case of WT and StrpR. e Broth dilution method shows high MIC values for the resistant populations against the respective antibiotics that they were evolved on. Legends are Blue for WT, Red for ChlR and Green for StrpR. Means ± S.D. represented in a, b and e (n ≥ 3)
