
Figure 1.
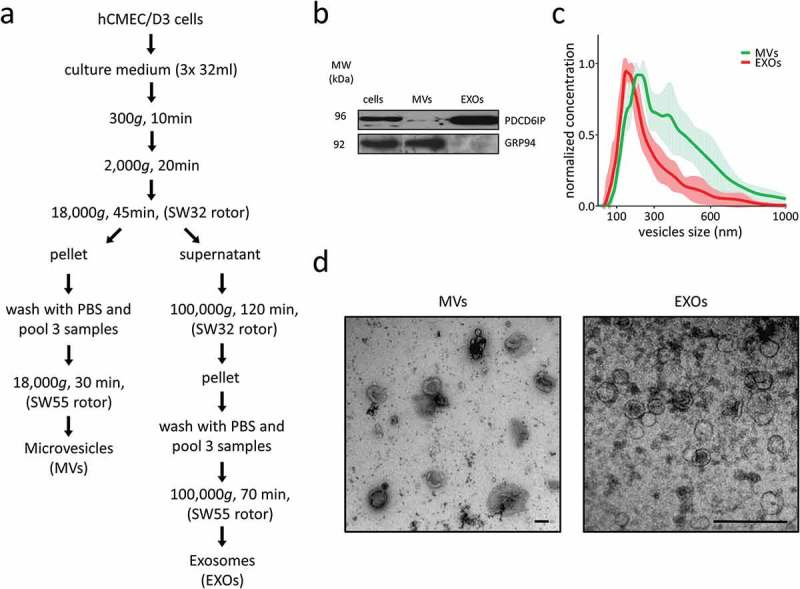
EV isolation and characterisation. (a) Microvesicles (MVs) and exosomes (EXOs) were isolated from the culture medium using differential centrifugation. (b) Western blot was performed on cell, MVs and EXOs by analysing the same amount of proteins. PDCD6IP was used as a marker for EVs, and GRP94 as a negative control for EXOs. (c) Size distribution of the two subsets. The average was calculated from five different measurements and plotted (line) together with the standard deviation (SD) (area). (d) Electron microscopy analysis of EVs. Scale bar represents 100 nm.