
Figure 4.
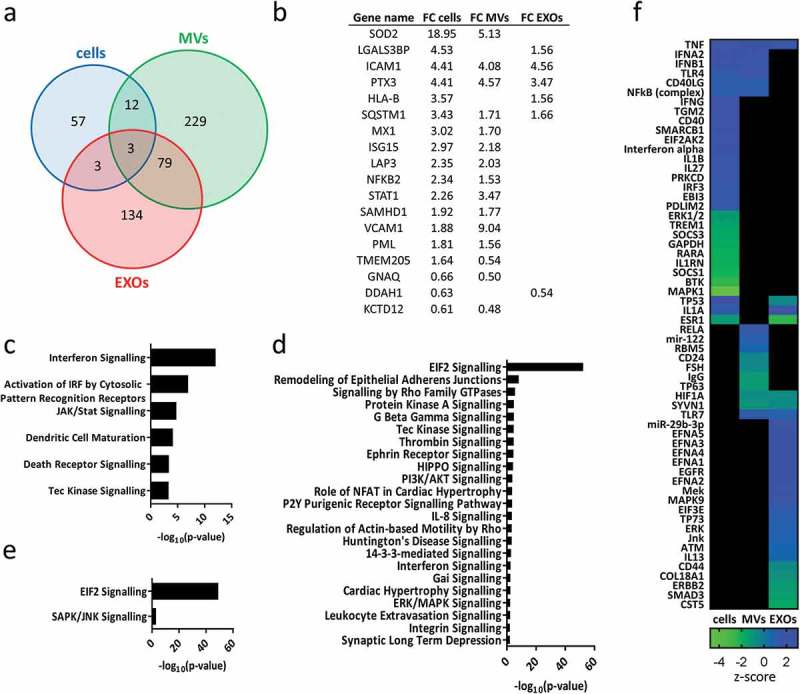
(a) Venn diagram displaying differentially expressed proteins after exposure to TNF in different samples: cells, MVs and EXOs. For detailed list see Supplementary Table 2. (b) Comparison of the fold-change (FC) of proteins found to be significantly up- or downregulated after exposure to TNF (p < 0.01, |FC|> 1.5) in both cells and EVs. The significant IPA canonical pathways enriched in cell (c), MV (d) and EXO (e) samples. The significance (–log10 (p-value)) for each pathway are displayed. (f) Heat map showing the results of the IPA upstream regulator analysis.