
Figure 6.
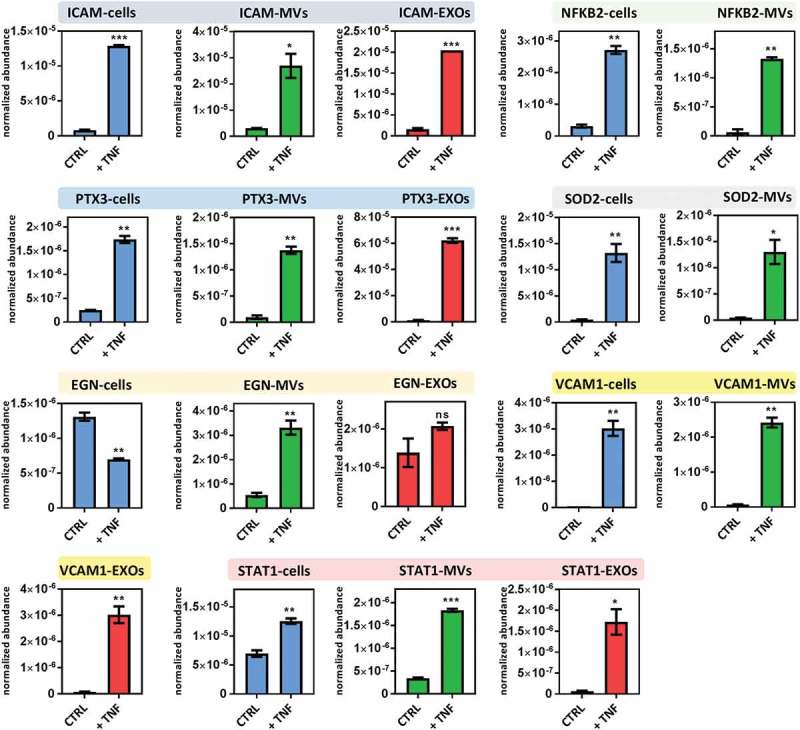
PRM analysis of proteins found differentially expressed in cells, MVs and EXOs after exposure to TNF. Average abundances were displayed with standard deviations. Asterisks indicate significance levels: ***p < 0.001, **p < 0.01, *p < 0.05.
Official websites use .gov
A
.gov website belongs to an official
government organization in the United States.
Secure .gov websites use HTTPS
A lock (
) or https:// means you've safely
connected to the .gov website. Share sensitive
information only on official, secure websites.
PRM analysis of proteins found differentially expressed in cells, MVs and EXOs after exposure to TNF. Average abundances were displayed with standard deviations. Asterisks indicate significance levels: ***p < 0.001, **p < 0.01, *p < 0.05.